Output files by directory#
Images#
The rule graph (located in images/) of the workflow:
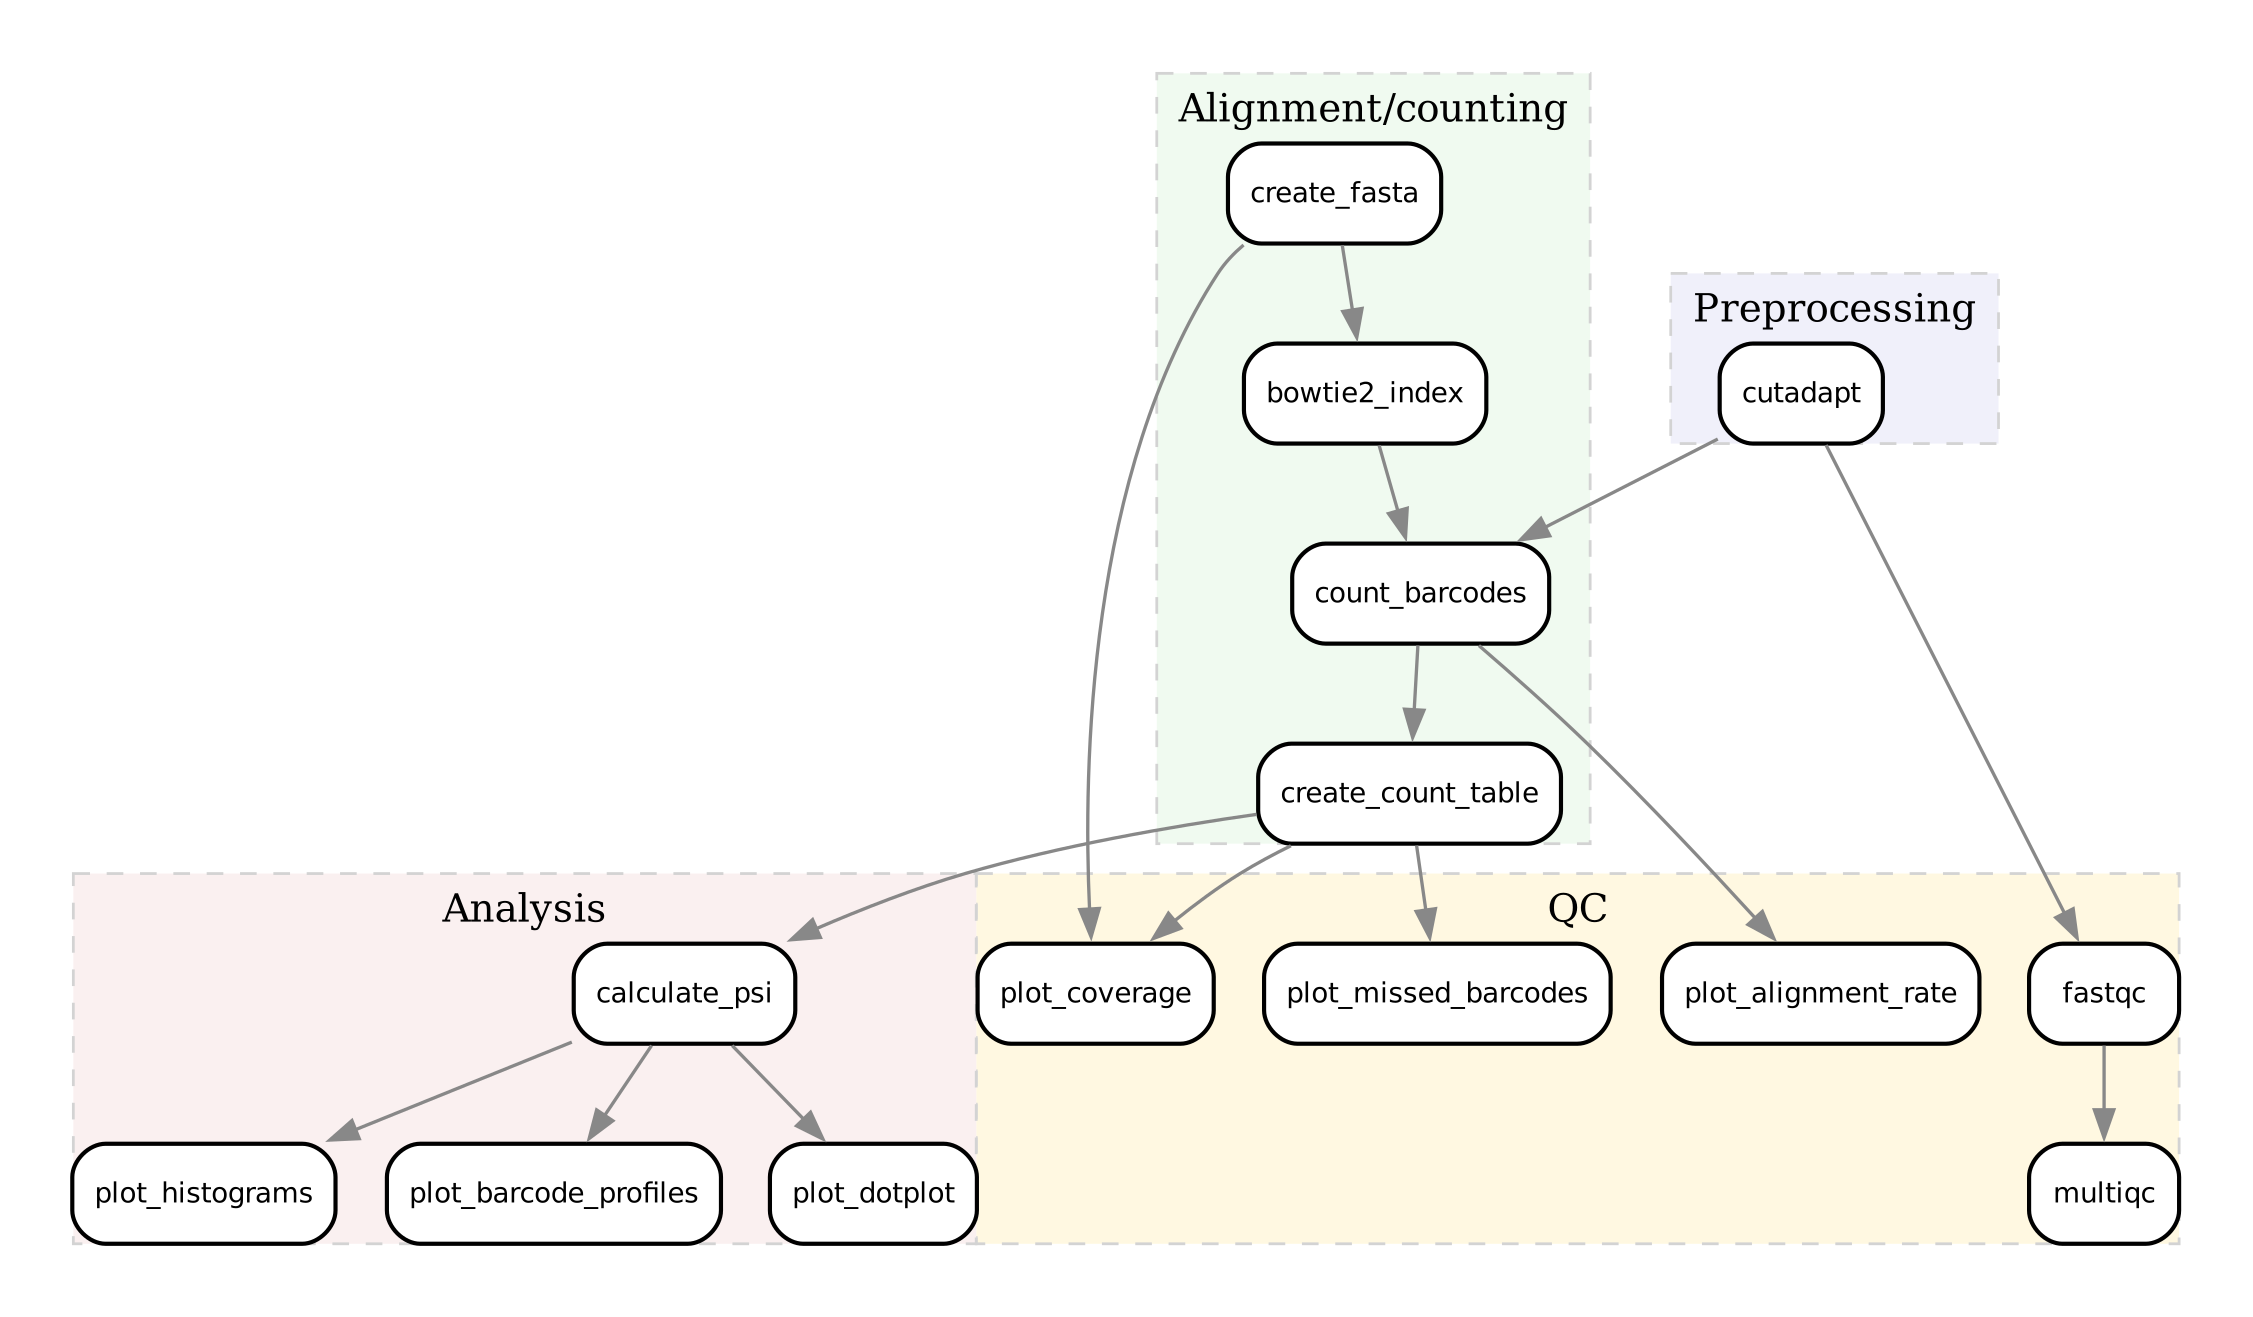
Rule graph of the GPSW workflow (dPSI analysis)#
Logs#
The logs/ directory contains the log files of the workflow.
Directory structure
logs/
├── bowtie2
│   └── index.log
├── calculate_psi
│   └── Test_vs_Control
│       └── hit-th1.25_prop_th0.4_pen_th4.log
├── count
│   ├── aggregate_counts.log
│   ├── Control_1.log
│   ├── Control_2.log
│   ├── Control_3.log
│   ├── Control_4.log
│   ├── Control_5.log
│   ├── Control_6.log
│   ├── Test_1.log
│   ├── Test_2.log
│   ├── Test_3.log
│   ├── Test_4.log
│   ├── Test_5.log
│   └── Test_6.log
├── create_fasta.log
├── cutadapt
│   ├── Control_1.log
│   ├── Control_2.log
│   ├── Control_3.log
│   ├── Control_4.log
│   ├── Control_5.log
│   ├── Control_6.log
│   ├── Test_1.log
│   ├── Test_2.log
│   ├── Test_3.log
│   ├── Test_4.log
│   ├── Test_5.log
│   └── Test_6.log
├── fastqc
│   ├── Control_1.log
│   ├── Control_2.log
│   ├── Control_3.log
│   ├── Control_4.log
│   ├── Control_5.log
│   ├── Control_6.log
│   ├── Test_1.log
│   ├── Test_2.log
│   ├── Test_3.log
│   ├── Test_4.log
│   ├── Test_5.log
│   └── Test_6.log
├── missed-rgrnas.log
├── multiqc
│   └── multiqc.log
├── plot-alignment-rate.log
├── plot-coverage.log
├── plot_histograms
│   └── hit-th1.25_prop_th0.4_pen_th4_Test_vs_Control.log
├── plot_psi
│   ├── dotplot_hit-th1.25_prop_th0.4_pen_th4_Test_vs_Control.log
│   └── hit-th1.25_prop_th0.4_pen_th4_Test_vs_Control.log
└── snakemake
   └── 2025-07-16_11-49-52_snakemake.log

10 directories, 48 files
z-score calculation log#
An important and informative log file is the logs/calculate_psi/Test_vs_Control/hit-th1.25_prop_th0.4_pen_th4.log file, which contains information about the normalisation and filtering steps of the barcodes and the subsequent z-score calculation. This file is generated by the calculate_psi rule and contains the following information:
INFO:2025-07-16 11:50:29:Filtering data for Test vs Control
INFO:2025-07-16 11:50:29:  Barcodes present pre-filtering: 135057
INFO:2025-07-16 11:50:29:  Barcodes with no counts in any sample: 18557
INFO:2025-07-16 11:50:29:  Largest sample: Test_4 with 147375.0 reads
INFO:2025-07-16 11:50:29:  Barcodes with low counts in both reference and test condition: 97854
INFO:2025-07-16 11:50:29:  Barcodes with no counts for Test in any bin: 0
INFO:2025-07-16 11:50:29:  ORFs removed that have only one barcode after filtering: 0
INFO:2025-07-16 11:50:29:  ORFs removed with less than 2 barcodes after filtering: 0
INFO:2025-07-16 11:50:29:  Number of barcodes present post-filtering: 14559
INFO:2025-07-16 11:50:29:  Marking twin peaked barcodes in:
INFO:2025-07-16 11:50:29:    Test
INFO:2025-07-16 11:50:33:    Control
INFO:2025-07-16 11:50:38:  Barcodes marked as having twin peaks: 4062
INFO:2025-07-16 11:50:38:  ORFs removed with less than 2 barcodes after removing  barcodes with twin peaks: 2632
INFO:2025-07-16 11:50:38:Computing PSI values for Test vs Control
INFO:2025-07-16 11:50:39:Calculating z-scores
INFO:2025-07-16 11:50:39:Correcting z-scores for number of barcodes
INFO:2025-07-16 11:50:39:  Median number of good barcodes: 3.0
INFO:2025-07-16 11:50:39:Correcting z-scores for intra ORF variability
INFO:2025-07-16 11:50:39:Correcting z-scores for deltaPSI
INFO:2025-07-16 11:50:39:Scaling z-scores
INFO:2025-07-16 11:50:39:Calculating proportions of reads in bins
INFO:2025-07-16 11:50:39:Writing barcode-level results to results/psi/hit-th1.25_prop_th0.4_pen_th4/Test_vs_Control_barcode.summary.csv
INFO:2025-07-16 11:50:39:Calling hits
INFO:2025-07-16 11:50:39:  Number of stabilised ORFs in Test_vs_Control: 5
INFO:2025-07-16 11:50:39:  Number of destabilised ORFs in Test_vs_Control: 13
INFO:2025-07-16 11:50:39:Ranking hits
INFO:2025-07-16 11:50:39:Writing ranked results to results/psi/hit-th1.25_prop_th0.4_pen_th4/Test_vs_Control_gene.summary.csv
INFO:2025-07-16 11:50:39:Done
Resources#
The resources/ directory contains the following files/directory:
<name>.csv: a CSV file with the ORF metadata, including the ORF ID, gene name, and other relevant information (placed by the user).
<name>.fasta: a FASTA file with the ORF sequences (generated by GPSW).
bowtie2_index/: a directory containing the Bowtie2 index files for the ORF sequences (generated by GPSW).
Results#
The output files of the workflow are stored in the results/ directory. The structure of the output files is as follows:
Directory structure
results/
├── count
│   └── counts-aggregated.tsv
├── psi
│   └── hit-th1.25_prop_th0.4_pen_th4
│       ├── Test_vs_Control_barcode.summary.csv
│       └── Test_vs_Control_gene.summary.csv
├── psi_plots
│   └── hit-th1.25_prop_th0.4_pen_th4
│       ├── Test_vs_Control
│       │   ├── destabilised
│       │   │   ├── AP2M1_IOH21478.pdf
│       │   │   ├── C3orf36_D52948.pdf
│       │   │   ├── C6orf201_U11005.pdf
│       │   │   ├── CDK16_D4804.pdf
│       │   │   ├── CXorf40B_IOH9866.pdf
│       │   │   ├── EIF3I_IOH3628.pdf
│       │   │   ├── GNAS_IOH39616.pdf
│       │   │   ├── INHBE_U3932.pdf
│       │   │   ├── MAPK8IP2_U13451.pdf
│       │   │   ├── PRPH2_IOH61916.pdf
│       │   │   ├── RPS18_IOH41520.pdf
│       │   │   ├── SCAMP1_IOH12951.pdf
│       │   │   └── UBL5_U5662.pdf
│       │   └── stabilised
│       │       ├── 0_U14469.pdf
│       │       ├── APOA2_IOH7290.pdf
│       │       ├── CHST9_IOH80001.pdf
│       │       ├── SLC31A2_U13112.pdf
│       │       └── XKR8_IOH14631.pdf
│       ├── Test_vs_Control_dotplot.pdf
│       ├── Test_vs_Control_dpsi_histogram.pdf
│       ├── Test_vs_Control_dpsi_sd_histogram.pdf
│       └── Test_vs_Control_psi_histogram.pdf
├── qc
│   ├── alignment-rates.pdf
│   ├── fastqc
│   │   ├── Control_1_fastqc.zip
│   │   ├── Control_1.html
│   │   ├── Control_2_fastqc.zip
│   │   ├── Control_2.html
│   │   ├── Control_3_fastqc.zip
│   │   ├── Control_3.html
│   │   ├── Control_4_fastqc.zip
│   │   ├── Control_4.html
│   │   ├── Control_5_fastqc.zip
│   │   ├── Control_5.html
│   │   ├── Control_6_fastqc.zip
│   │   ├── Control_6.html
│   │   ├── Test_1_fastqc.zip
│   │   ├── Test_1.html
│   │   ├── Test_2_fastqc.zip
│   │   ├── Test_2.html
│   │   ├── Test_3_fastqc.zip
│   │   ├── Test_3.html
│   │   ├── Test_4_fastqc.zip
│   │   ├── Test_4.html
│   │   ├── Test_5_fastqc.zip
│   │   ├── Test_5.html
│   │   ├── Test_6_fastqc.zip
│   │   └── Test_6.html
│   ├── missed-barcodes.pdf
│   ├── multiqc.html
│   └── sequence-coverage.pdf
└── trimmed
   ├── Control_1.qc.txt
   ├── Control_2.qc.txt
   ├── Control_3.qc.txt
   ├── Control_4.qc.txt
   ├── Control_5.qc.txt
   ├── Control_6.qc.txt
   ├── Test_1.qc.txt
   ├── Test_2.qc.txt
   ├── Test_3.qc.txt
   ├── Test_4.qc.txt
   ├── Test_5.qc.txt
   └── Test_6.qc.txt

11 directories, 65 files
Count#
The count directory contains the aggregated, non-normalised counts of barcodes across all conditions and bins (counts-aggregated.tsv).
barcode_id |
orf_id |
gene |
Control_1 |
Control_2 |
Control_3 |
Control_4 |
Control_5 |
Control_6 |
Test_1 |
Test_2 |
Test_3 |
Test_4 |
Test_5 |
Test_6 |
|---|---|---|---|---|---|---|---|---|---|---|---|---|---|---|
1_IOH10003_2802_PLD2 |
IOH10003 |
PLD2 |
0 |
2 |
0 |
11 |
12 |
0 |
0 |
5 |
3 |
11 |
9 |
0 |
2_IOH10003_2802_PLD2 |
IOH10003 |
PLD2 |
1 |
3 |
1 |
11 |
12 |
3 |
0 |
3 |
6 |
13 |
7 |
3 |
3_IOH10003_2802_PLD2 |
IOH10003 |
PLD2 |
0 |
29 |
8 |
51 |
126 |
66 |
17 |
7 |
36 |
0 |
12 |
0 |
PSI#
For each combination of hit threshold, proportion threshold and penalty factor, the psi directory contains the following files:
Test_vs_Control_barcode.summary.csv: a CSV file with barcode-level results.barcode_id
orf_id
gene
Control_1
Control_2
Control_3
Control_4
Control_5
Control_6
Test_1
Test_2
Test_3
Test_4
Test_5
Test_6
SOB_Control
SOB_Test
num_barcodes
twin_peaks
good_barcodes
PSI_Control
PSI_Test
PSI_Control_mean
PSI_Test_mean
deltaPSI
delta_PSI_mean
delta_PSI_SD
z_score
z_score_corr
18_IOH10009_315_C9orf80
IOH10009
C9orf80
0.0
0.047
0.047
0.0
0.428
0.476
0.034
0.0
0.0
0.103
0.551
0.310
21.0
29.0
4
False
3
5.238
5.068
5.184
5.116
-0.169
-0.068
0.311
0.366
1.010
19_IOH10009_315_C9orf80
IOH10009
C9orf80
0.0
0.066
0.133
0.0
0.267
0.533
0.0
0.043
0.0
0.043
0.391
0.521
15.0
23.0
4
False
3
5.066
5.347
5.184
5.116
0.281
-0.068
0.311
0.366
1.010
20_IOH10009_315_C9orf80
IOH10009
C9orf80
0.045
0.090
0.0
0.272
0.272
0.318
0.0
0.0
0.05
0.2
0.65
0.1
22.0
20.0
4
True
3
NA
NA
5.184
5.116
NA
-0.068
0.311
0.366
1.010
Test_vs_Control_gene.summary.csv: a CSV file with the gene-level results. This file contains, among others, the z-scores for each gene, and whether a gene is stabilised/destabilised in the test condition compared to the control condition, as well as an associated ranking.orf_id
gene
delta_PSI_mean
good_barcodes
stabilised
destabilised
z_score_corr
stabilised_rank
destabilised_rank
IOH10176
TYROBP
1.637
3
True
False
1.3896
31
NA
IOH10333
C10orf54
1.647
3
True
False
1.572
22
NA
IOH11069
UBD
-1.882
2
False
True
-3.717
NA
1
PSI Plots#
The psi_plots directory contains the following subdirectories for each combination of hit threshold, SD threshold, proportion threshold and penalty factor:
- Test_vs_Control: contains the following subdirectories:
- destabilised_in_Test: contains PDF files with the barcode profiles for each destabilised gene in the test condition.
stabilised_in_Test: contains PDF files with the barcode profiles for each stabilised gene in the test condition.
Example of barcode profile:
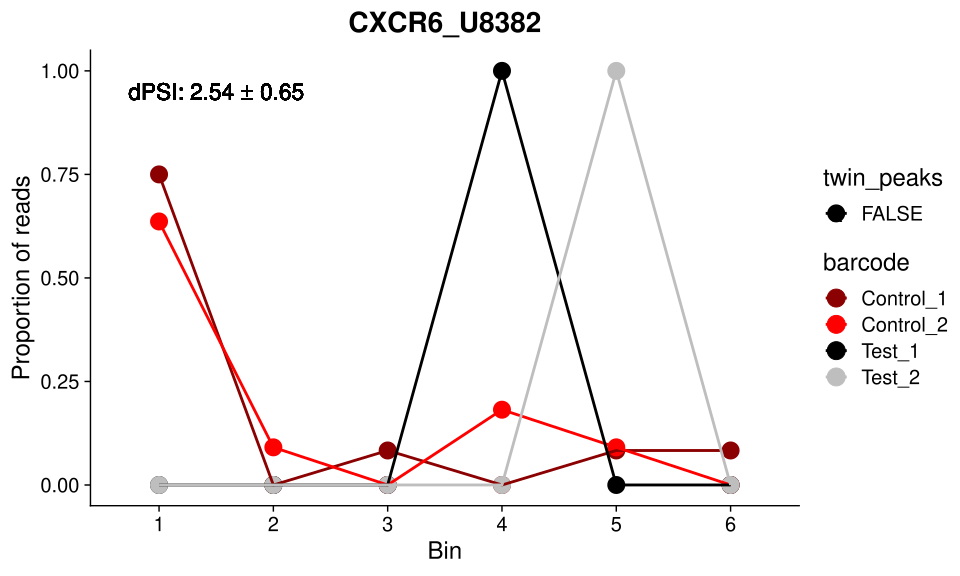
Barcode profile for a stabilised gene in the test condition.#
Test_vs_Control_dotplot.pdf: a PDF file with a dot plot of the z-scores for each gene in the test condition compared to the control condition.
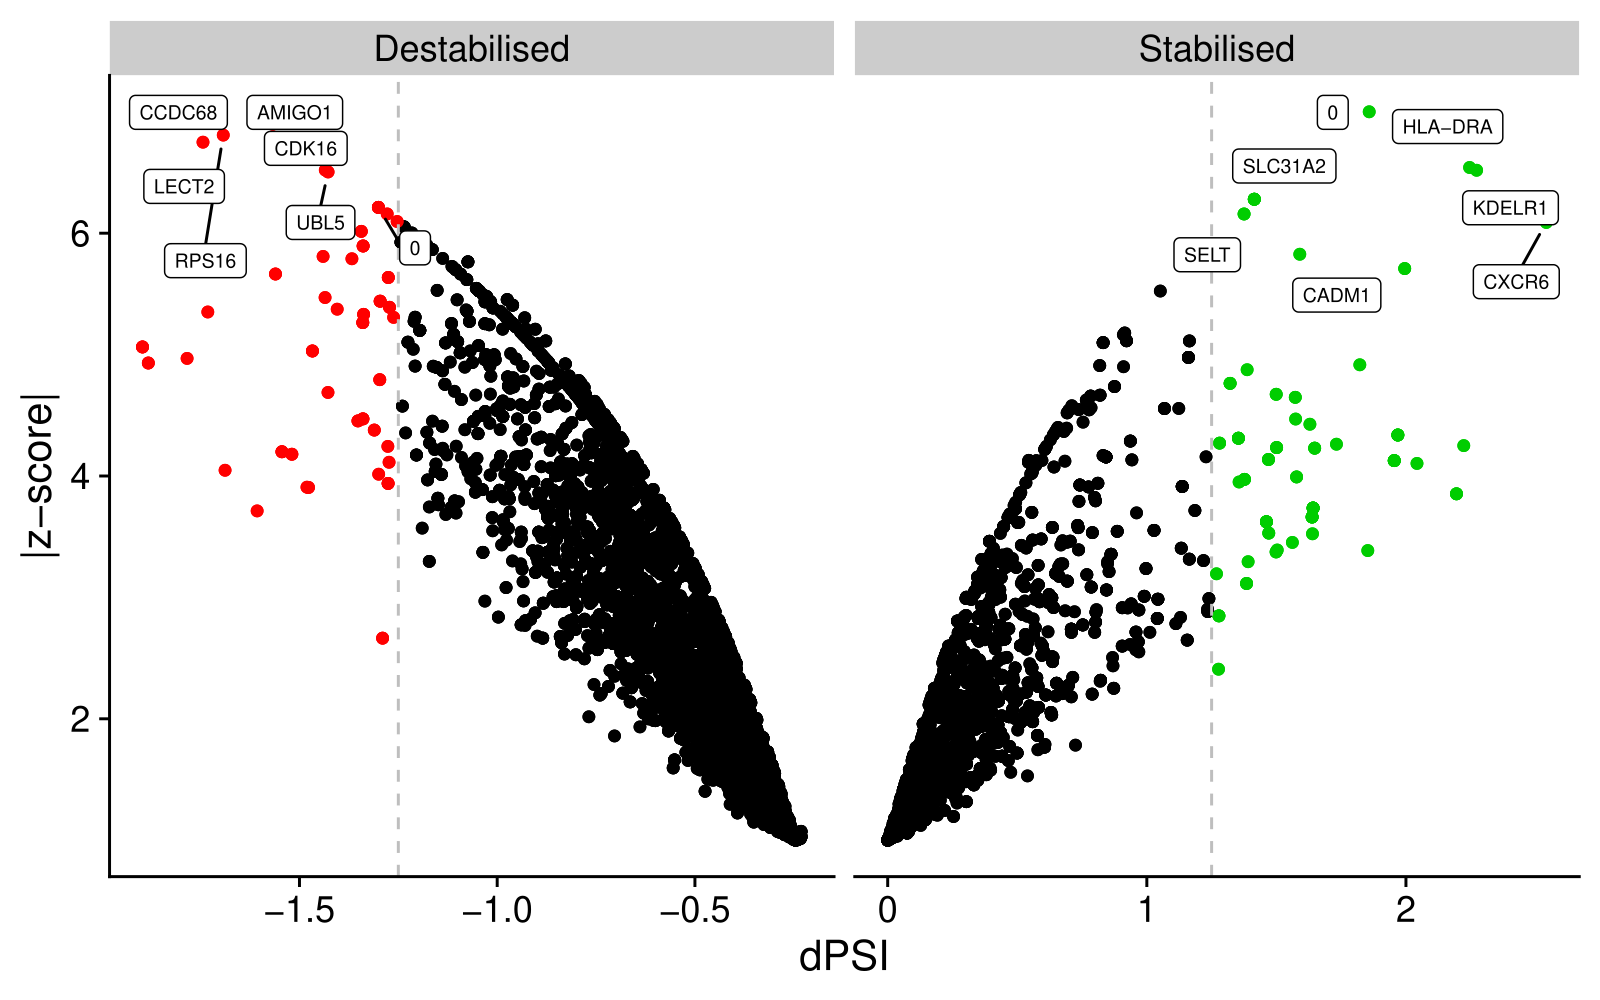
Dot plot of z-scores for each gene in the test condition compared to the control condition.#
Note
Proteins whose \(|dPSI_i|\) is smaller than the mean \(|dPSI_i|\) are omitted from the plots to avoid visual clutter around the origin.
Test_vs_Control_psi_histogram.pdf: a PDF file with a histogram of the \(\Psi_i\) values for all genes.
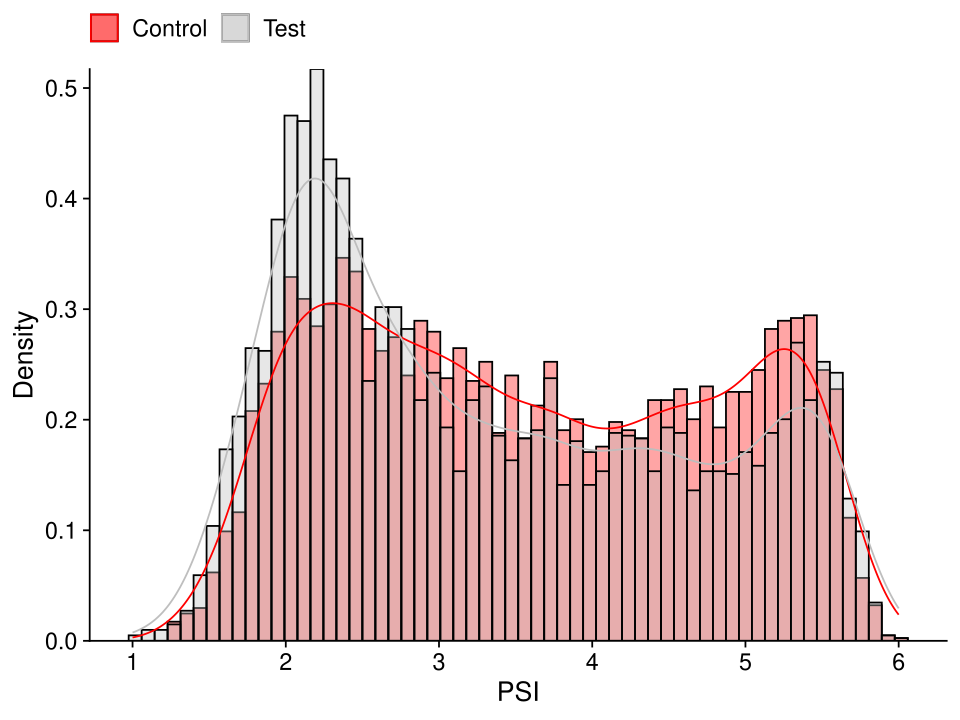
Histogram of PSI values.#
Test_vs_Control_dpsi_histogram.pdf: a PDF file with a histogram of the \(dPSI_i\) values for all genes.
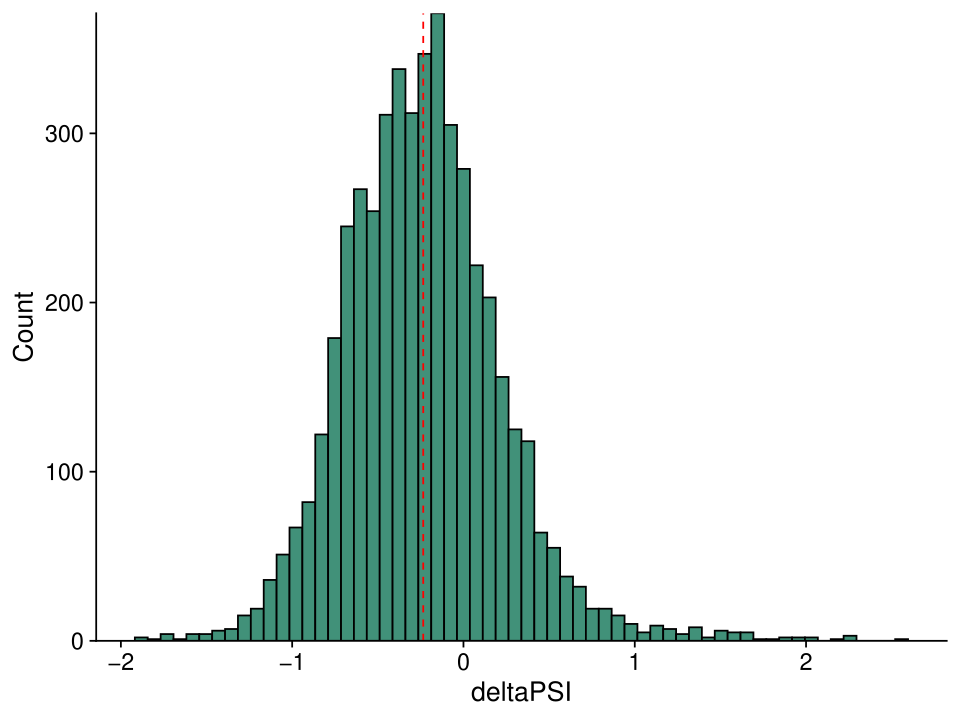
Histogram of delta PSI values.#
Test_vs_Control_dpsi_sd_histogram.pdf: a PDF file with a histogram of the \(dPSI_i\) SD values for all genes.
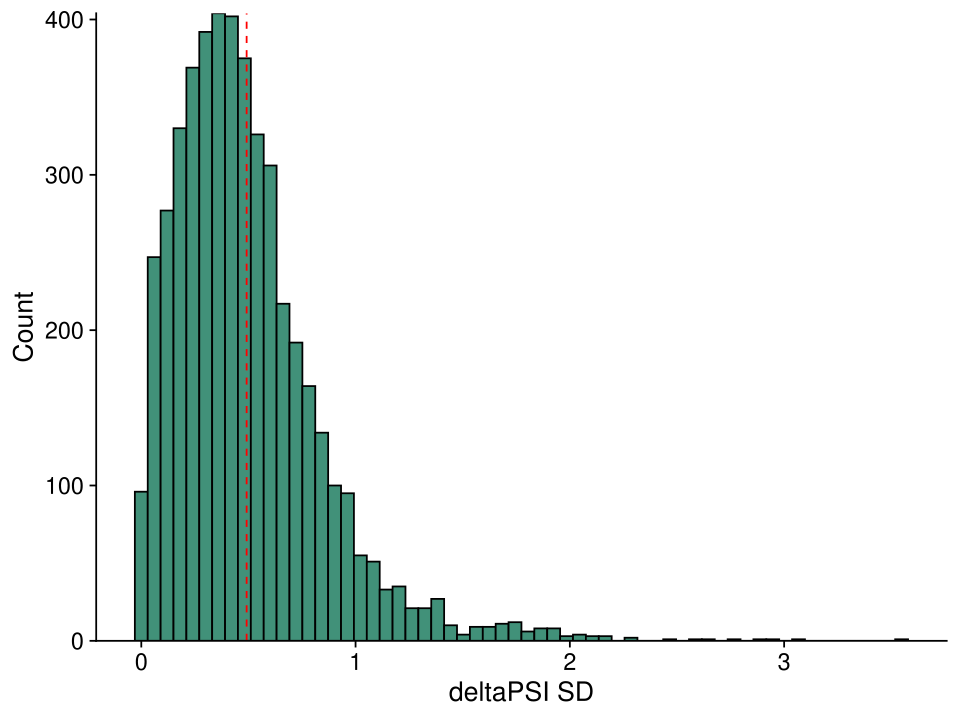
Histogram of delta PSI SD values.#
Test_vs_Control_sob_histogram.pdf: a PDF file with a histogram of the sum of barcodes (SOB) values for all genes per condition.
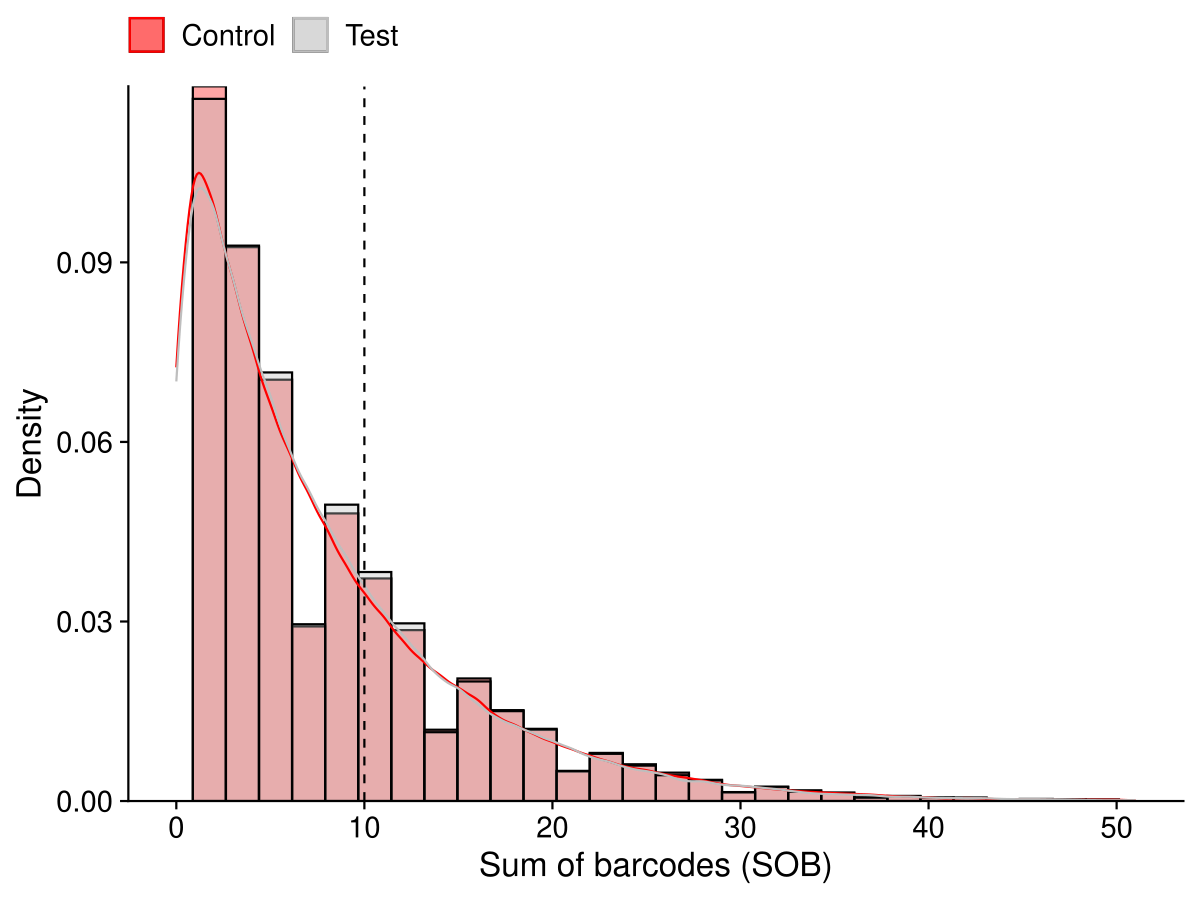
Histogram of SOB values. Only the 99.9th percentile of SOB values is shown in the histogram.#
QC#
Alignment rates of individual samples#
Bowtie2 alignment rates for each sample are visualised in alignment-rates.pdf file.
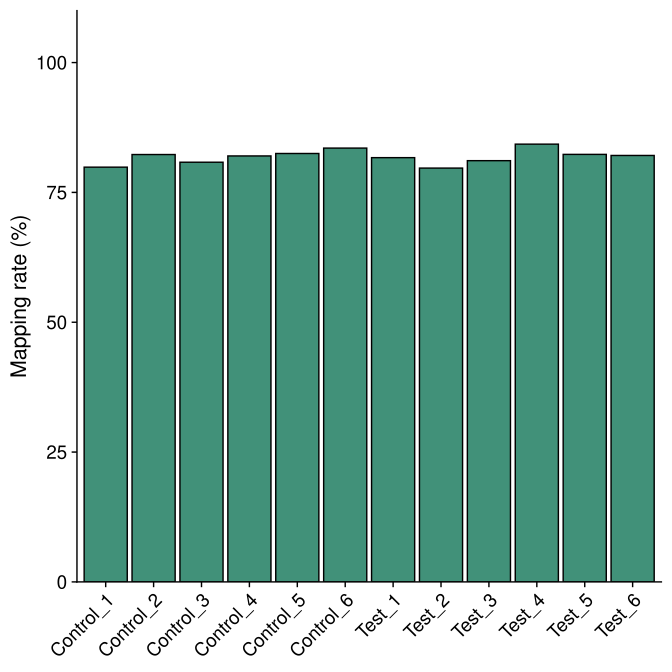
Alignment rates of individual samples.#
Missed barcodes#
The missed-barcodes.pdf file contains a plot of the number of barcodes that were not detected in each bin for each condition. This is useful to identify bins with low coverage or issues with barcode detection.
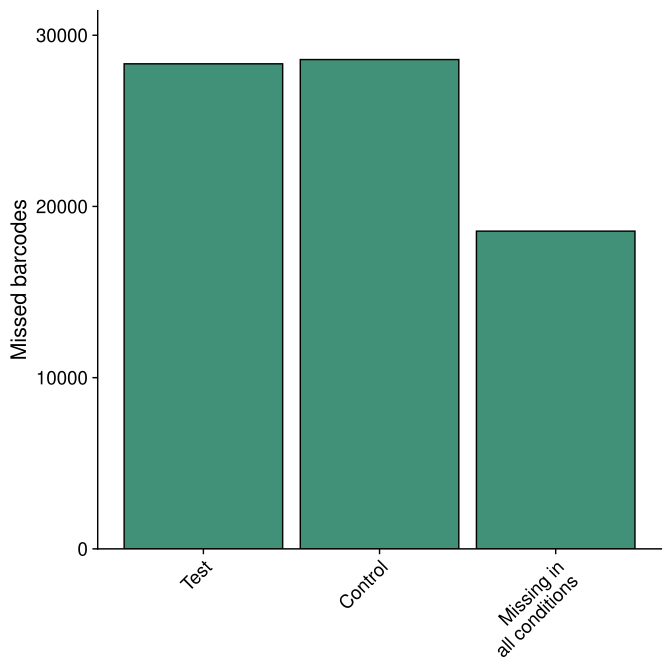
Missed barcodes.#
Sequence coverage#
The sequence-coverage.pdf file contains a plot of the sequence coverage across all bins for each condition. This is useful to identify bins with low coverage or issues with barcode detection.
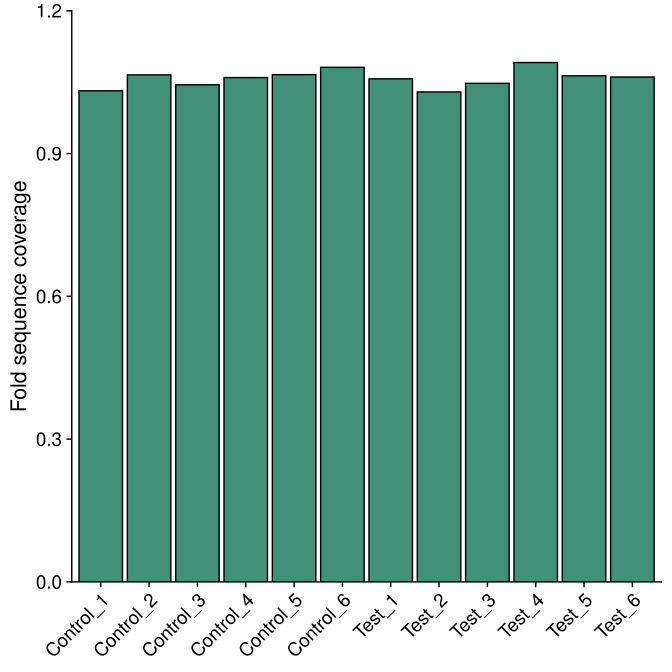
Sequence coverage.#
The sequence coverage is calculated by dividing the number of sequencing reads in each bin by the total number of barcodes in the ORF library.
MultiQC report#
The multiqc.html file contains a summary of the quality control metrics for the trimmed reads.
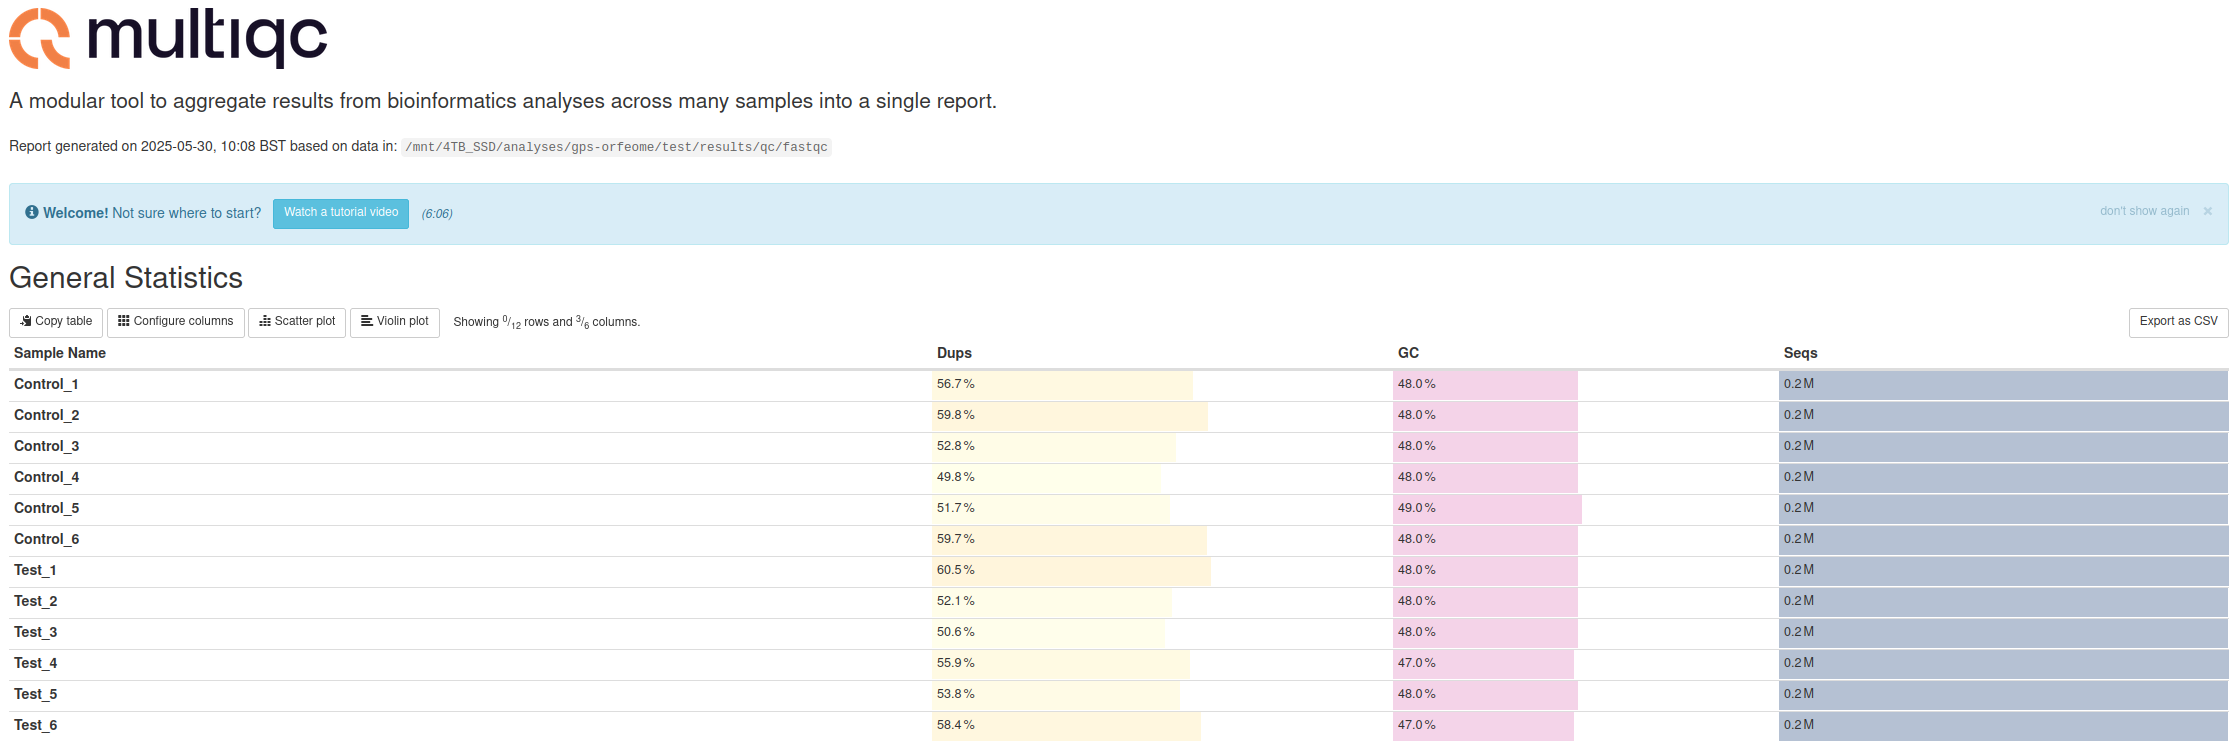
MultiQC report.#
Trimmed#
The trimmed directory contains the quality control files for each sample after trimming with cutadapt. These files contain information about the number of reads before and after trimming, the number of reads that were discarded, and the number of reads that were kept.
Example of a trimmed sample quality control file
This is cutadapt 4.9 with Python 3.12.10
Command line parameters: --cores 4 -g CCAGTAGGTCCACTATGAGT -l 20 -q 20 --discard-untrimmed -o results/trimmed/Control_1.fastq.gz reads/Control_1.fastq.gz
Processing single-end reads on 4 cores ...
Finished in 0.842 s (4.809 µs/read; 12.48 M reads/minute).

=== Summary ===

Total reads processed:                 175,000
Reads with adapters:                   174,492 (99.7%)
Reads written (passing filters):       174,492 (99.7%)

Total basepairs processed:    26,250,000 bp
Quality-trimmed:                  27,953 bp (0.1%)
Total written (filtered):      3,489,639 bp (13.3%)

=== Adapter 1 ===

Sequence: CCAGTAGGTCCACTATGAGT; Type: regular 5'; Length: 20; Trimmed: 174492 times

Minimum overlap: 3
No. of allowed errors:
1-9 bp: 0; 10-19 bp: 1; 20 bp: 2

Overview of removed sequences
length    count   expect  max.err error counts
3 133     2734.4  0       133
4 1       683.6   0       1
18        3       0.0     1       2 1
19        47      0.0     1       6 38 3
20        19984   0.0     2       17434 2236 314
21        19934   0.0     2       17471 2165 298
22        24169   0.0     2       21274 2541 354
23        25389   0.0     2       22189 2779 421
24        23155   0.0     2       20282 2529 344
25        24034   0.0     2       21051 2524 459
26        20808   0.0     2       18067 2310 431
27        16792   0.0     2       14576 1895 321
28        34      0.0     2       13 18 3
31        1       0.0     2       1
32        1       0.0     2       0 0 1
33        1       0.0     2       1
36        1       0.0     2       1
37        1       0.0     2       1
38        1       0.0     2       1
40        1       0.0     2       1
47        1       0.0     2       1
57        1       0.0     2       0 1
Output with multiple test conditions#
When running the workflow with multiple test conditions, additional files will be created in results/.
PCA plot#
The qc/pca_plot.pdf file contains a PCA plot of the ORF counts for all conditions. This plot is useful to visualise the overall distribution of ORF counts across different conditions and to identify potential outliers.
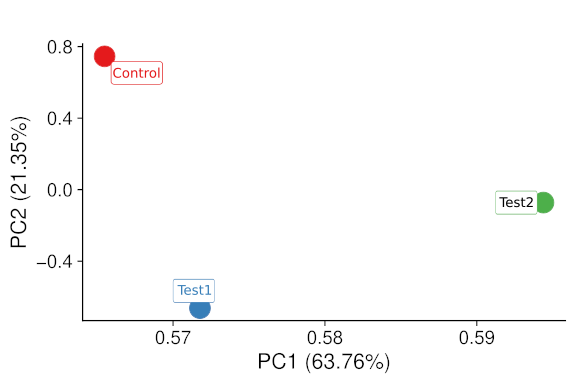
PCA plot of the ORF counts for all conditions.#
Heatmap of \(dPSI_i\) values of all comparisons#
The psi_plots directory contains pdf/csv files with the heatmap data of \(dPSI_i\) values for each ORF found as hits in any of the comparisons.
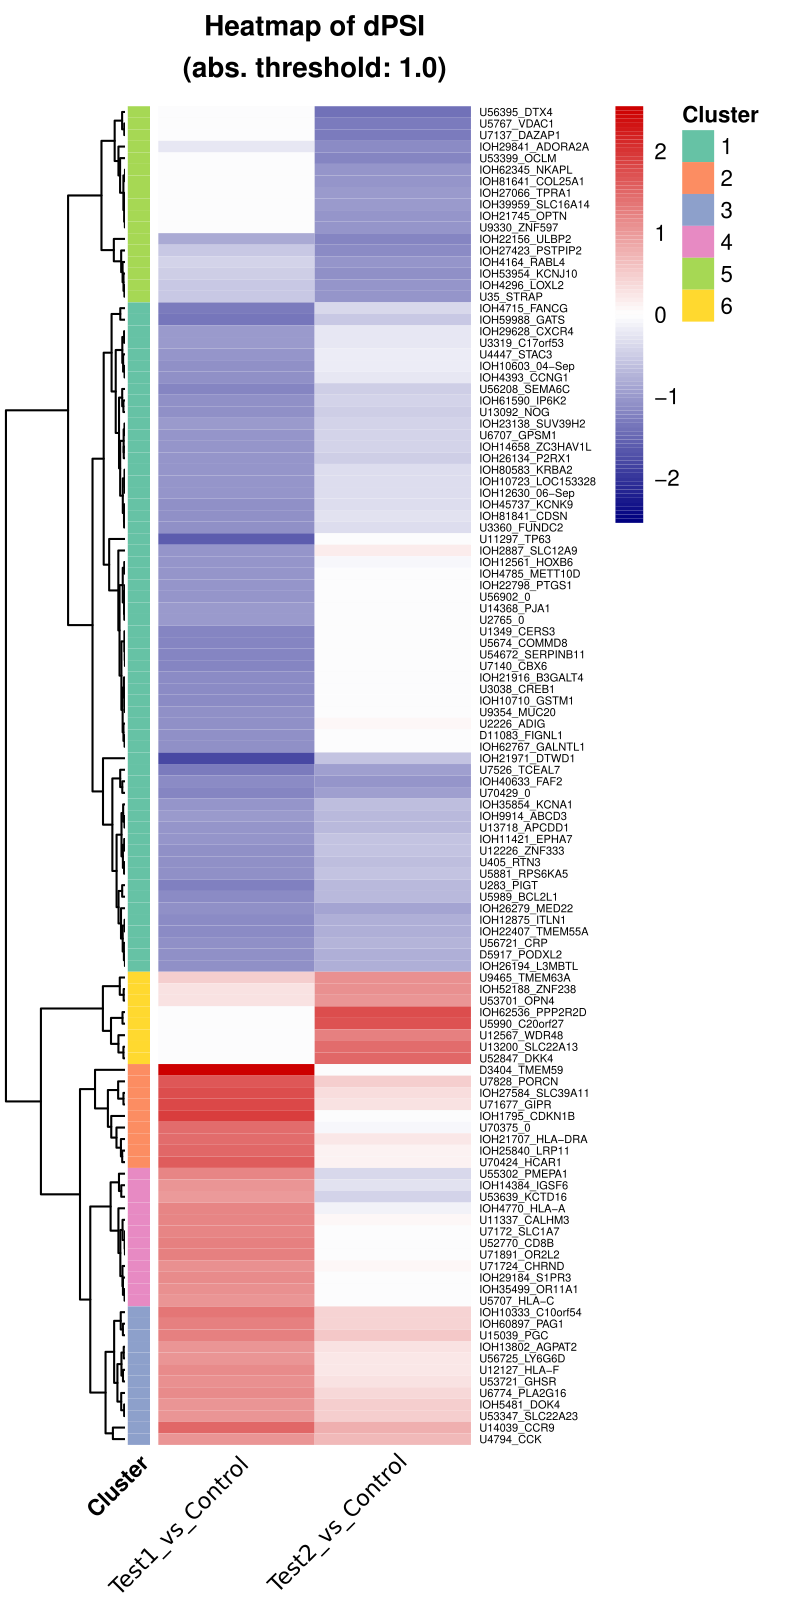
Heatmap of \(dPSI_i\) values for all comparisons.#
Note
As the clustering algorithm does not allow missing data (some genes are not found in all comparisons), missing data is replaced with \(dPSI_i = 0\).